IELTS WRITING TASK 1 WITH A MODEL ANSWER - PIE CHART
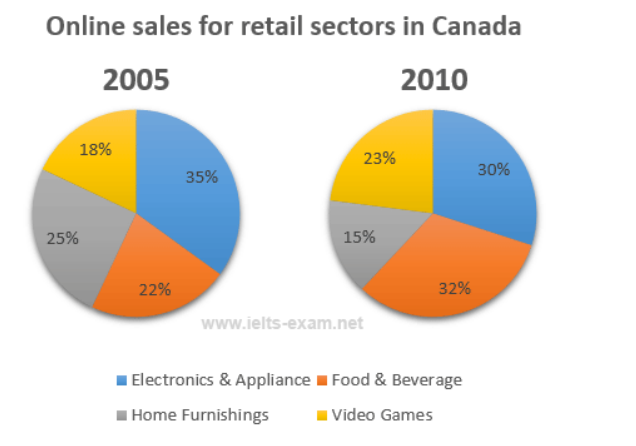
The two pie charts below show the online shopping sales for retail sectors in Canada in 2005 and 2010
Summarize the information by selecting and reporting the main features, and make comparisons where relevant.
Write at least 150 words
Model sample:
The charts compare four retail sectors in Canada in terms of the proportion of their internet sales in two years, 2005 and 2010.
Overall, the proportion of online sales for each of the four sectors changed significantly from 2005 to 2010. While the figures for food and beverages and also video games increased, the figures for the other two sectors fell.
In 2005, the proportion of online sales of food and beverages was 22%, but this rose to 32% in 2010. The percentage for internet sales of video games also went up, by 5% from the 2005 figure of 18%.
In contrast, the percentages of the online sales of the other sectors decreased. The most dramatic fall was in the home furnishings retail sector. While this figure was 25% of the total online sales of these four sectors in 2005, it fell to just 15% in 2010. There was also a decrease in the electronics and appliances sector, which saw a fall from 35% in 2005 to 30% in 2010.
(170 words)
Comments
Post a Comment