IELTS WRITING TASK 1 WITH A MODEL ANSWER - BAR CHART
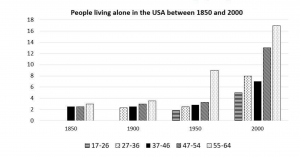
The bar chart below shows the percentage of people living alone in 5 different age groups in the US from 1850 to 2000.
Sample:
The chart compares the proportion of US citizens living alone from 1850 to 2000 in terms of various age groups.
Overall, it is clear that the percentage of the US population living alone increased over the period in all age groups. The highest proportion of those who lived alone was among the 55-64 year-olds.
In 1850, figures for three age groups are given. Just over 2% of those aged 37-46 and those aged 47-54 lived alone, slightly less than 3% for the 55-64 age group. In 1900 the proportion of those living alone in the 37-46 category remained stable, but there were small increases in the figures for the 47–54 and 55-64 year-olds, compared with only 2% of those aged 17-26.
A new pattern emerged in 1950, with the percentage of those living alone increasing according to age. The year 2000 then saw a rise in the proportions of people living alone, with the percentage of the 55 -64 year olds almost doubling to 17%, ahead of the 47-54 and 27-36 age groups with 13% and 8% respectively. While 5% of the 17-26 group lived alone, the figure was higher among the 37-46 year-olds at 7%.
197 words
Comments
Post a Comment